From GIS to Illustrator


Tutorial Information
- Module 1 in Design and Representation for Planners.
Methods
Tools
QGIS Preparation
Import Layers
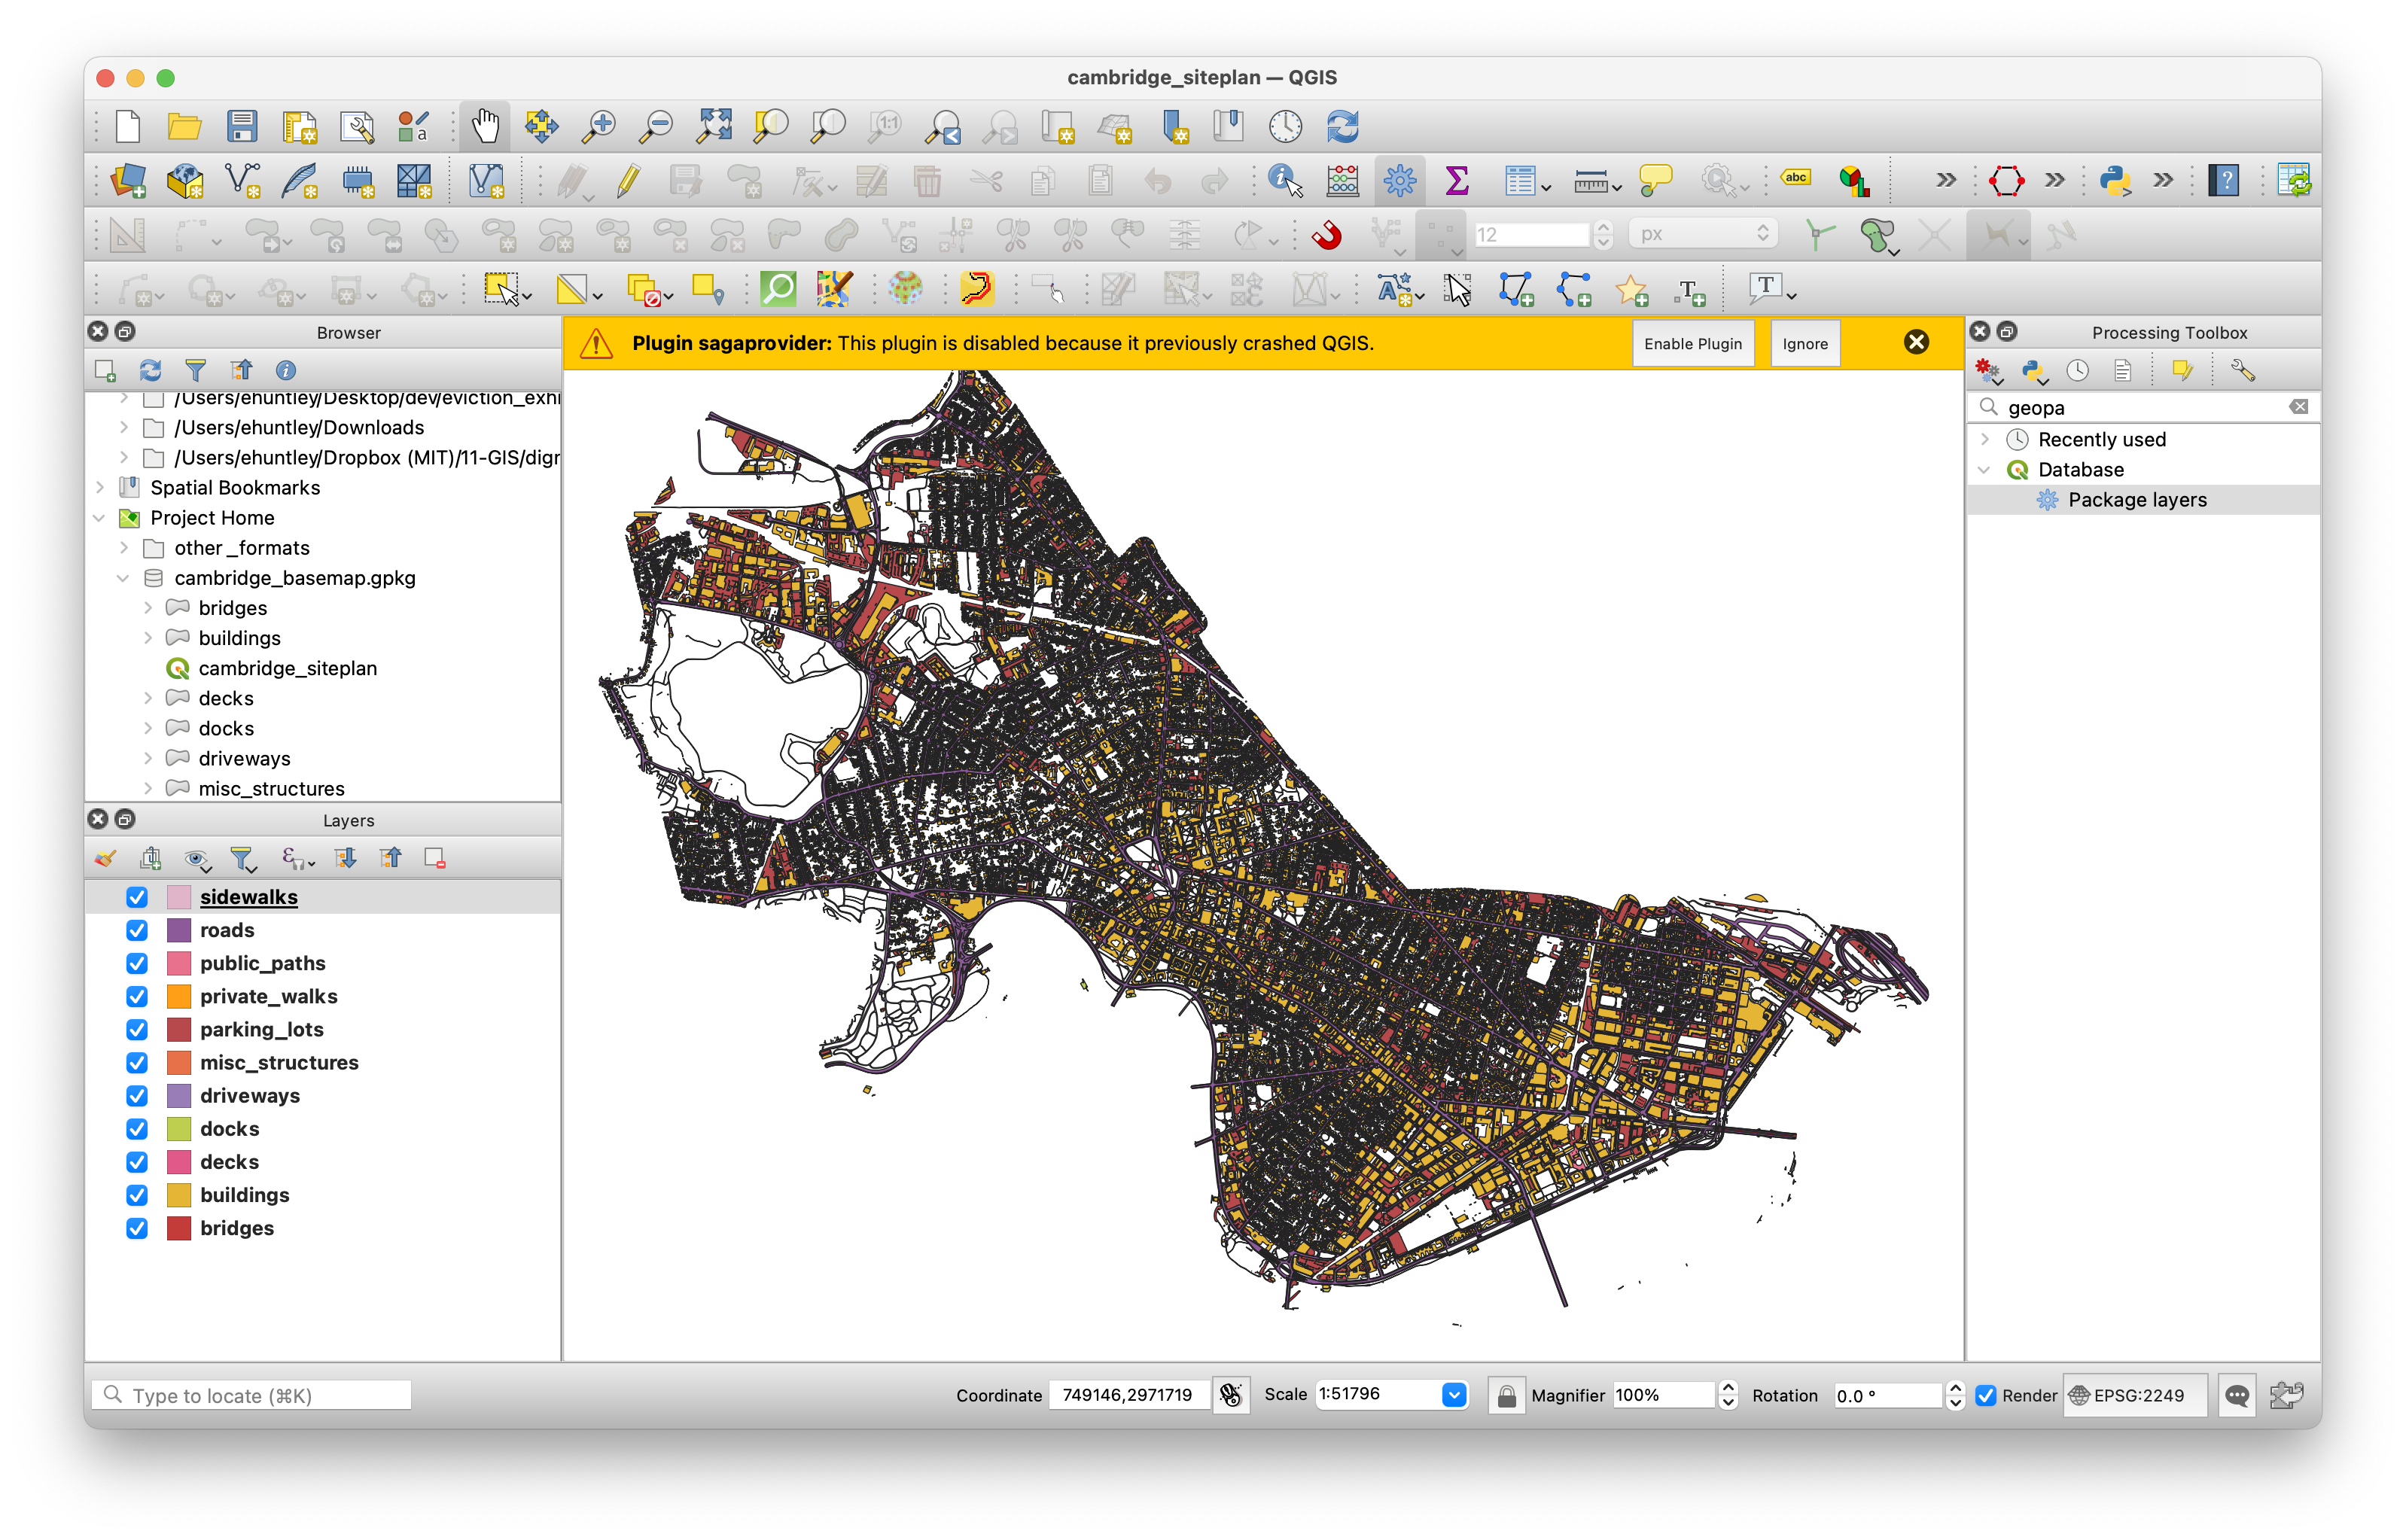
We’ve provided a QGIS project file called
cambridge_siteplan.qgz; when you open it, you’ll see layers
comprising a Cambridge basemap. These are sourced from the City of
Cambridge, MA, specifically the City
of Cambridge GIS.
If you dig through the project directory, you’ll see that we’ve
provided data in multiple formats. In the project itself, we’ve loaded
the feature layers from a geopackage (a
.gpkg)—this is a newer, open source spatial data format
based on a database technology SQLite that supports storing multiple
layers in a single file along with e.g., styling information and
metadata. (It also has the advantage of providing a single-file
interface to an entire project’s worth of data.) You’ll notice that
there’s also a QGIS project file stored in the geopackage:
geopackages can store QGIS project files as well. You’ll often find that
open source software plays well with other open source software.
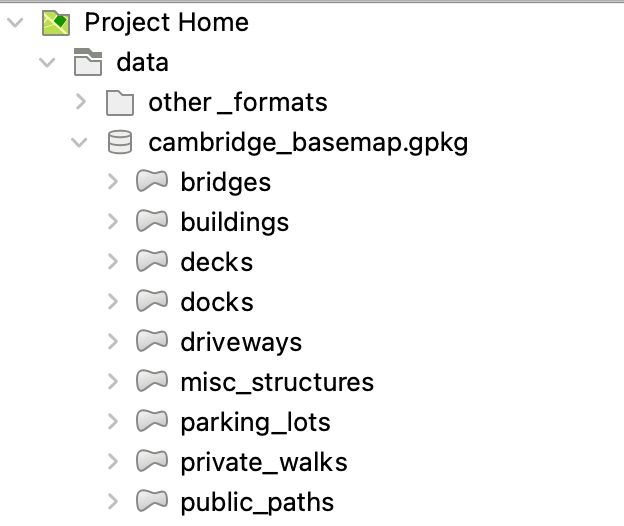
If you’re more comfortable with Shapefiles or GeoJSON files, though,
you can find these in the data > other_formats
folder.
Define Layout View and Bookmark
So far, we have all our layers loaded—it’s not pretty, but we’ll wait to make it so in Illustrator! Because we’re going to be relying on the Adobe Suite for styling today, we’ll leave it this way and proceed to framing and exporting our map.
First, create a new layout and give it the name “site plan output” or
one that makes sense to you. (File > New Print Layout)
When you open the layout, let’s resize our print page. You’ll find that
in urban design work, you’ll need to be able to work with page sizes
other than the standard letter size! Right-click the blank page and
select ‘Page properties’—you’ll see something like the below, with
different settings. Change these to match the below screenshot! I.e., a
custom page with a width of 17 inches and height of 11 inches. This page
size is commonly called ‘tabloid’.
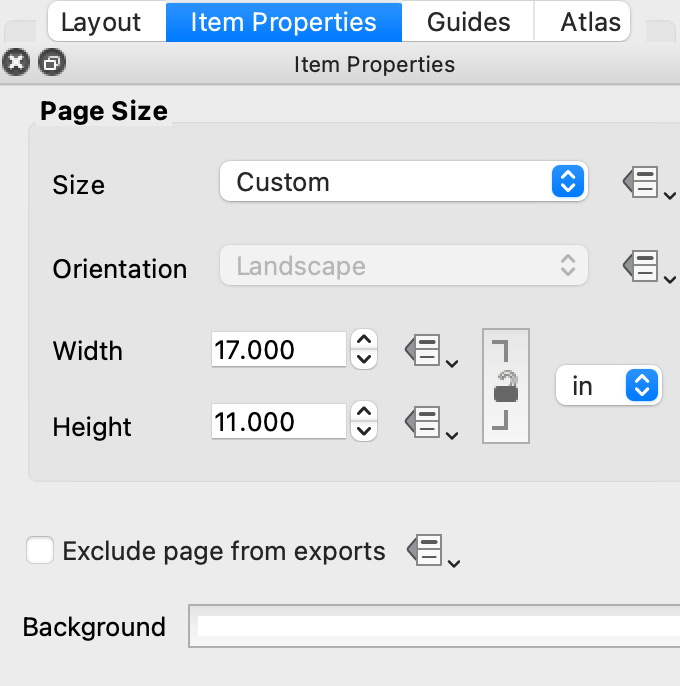
You can also use the size ANSI B—this is another name for tabloid. ANSI stands for the American National Standards Institute and these codes correspond to common pages sizes in the US. ANSI A is letter (8.5” x 11”), ANSI C is 17” x 22”, etc.
Add a new
map— —to
fill the page. Because in urban design and architectural work, you’ll
often want to be precise about the scale at which you’re working, we’ll
set this manually rather than zooming. Right-click on the map and choose
“item properties;” set the scale to 5000. (See below.) This means
—to
fill the page. Because in urban design and architectural work, you’ll
often want to be precise about the scale at which you’re working, we’ll
set this manually rather than zooming. Right-click on the map and choose
“item properties;” set the scale to 5000. (See below.) This means
1:5000, a fairly standard drawing scale for neighborhood
plans—in plain English, a given building will be 5000 times smaller on
the page than in the world. Now, slide the extent of the map around
using the “move item content” tool
 to frame the area of interest. (I’ve chosen Kendall Square.)
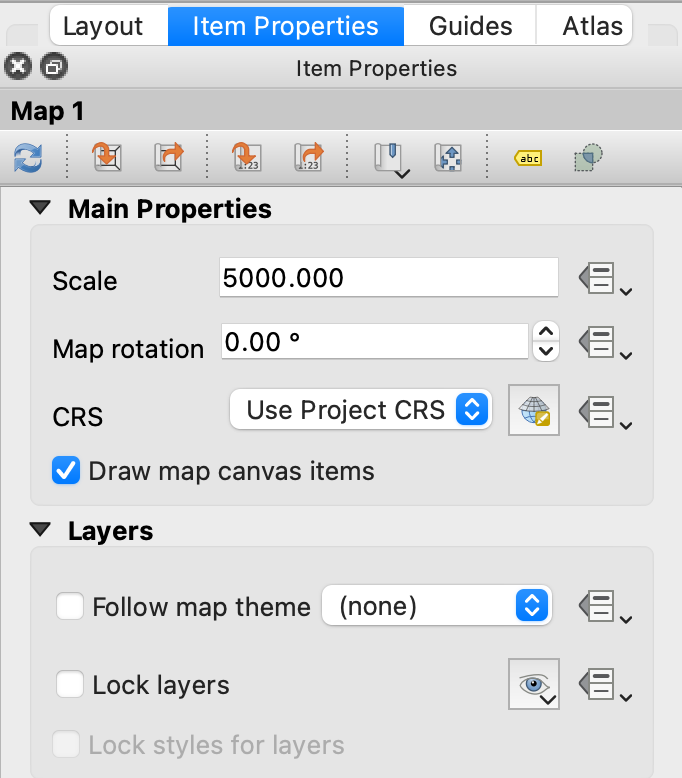
Finally, click the Bookmarks dropdown at the top of the map properties and select “New bookmark” and give it a name (e.g., “Kendall”)—this is so that if you accidentally change the map extent, you can easily find your way back to the extent and scale of interest.
Finally, add a scale bar and north arrow. This will make our life in Illustrator much easier after we’ve lost the map’s explicit spatial information. Your map before exporting should look something like the below.
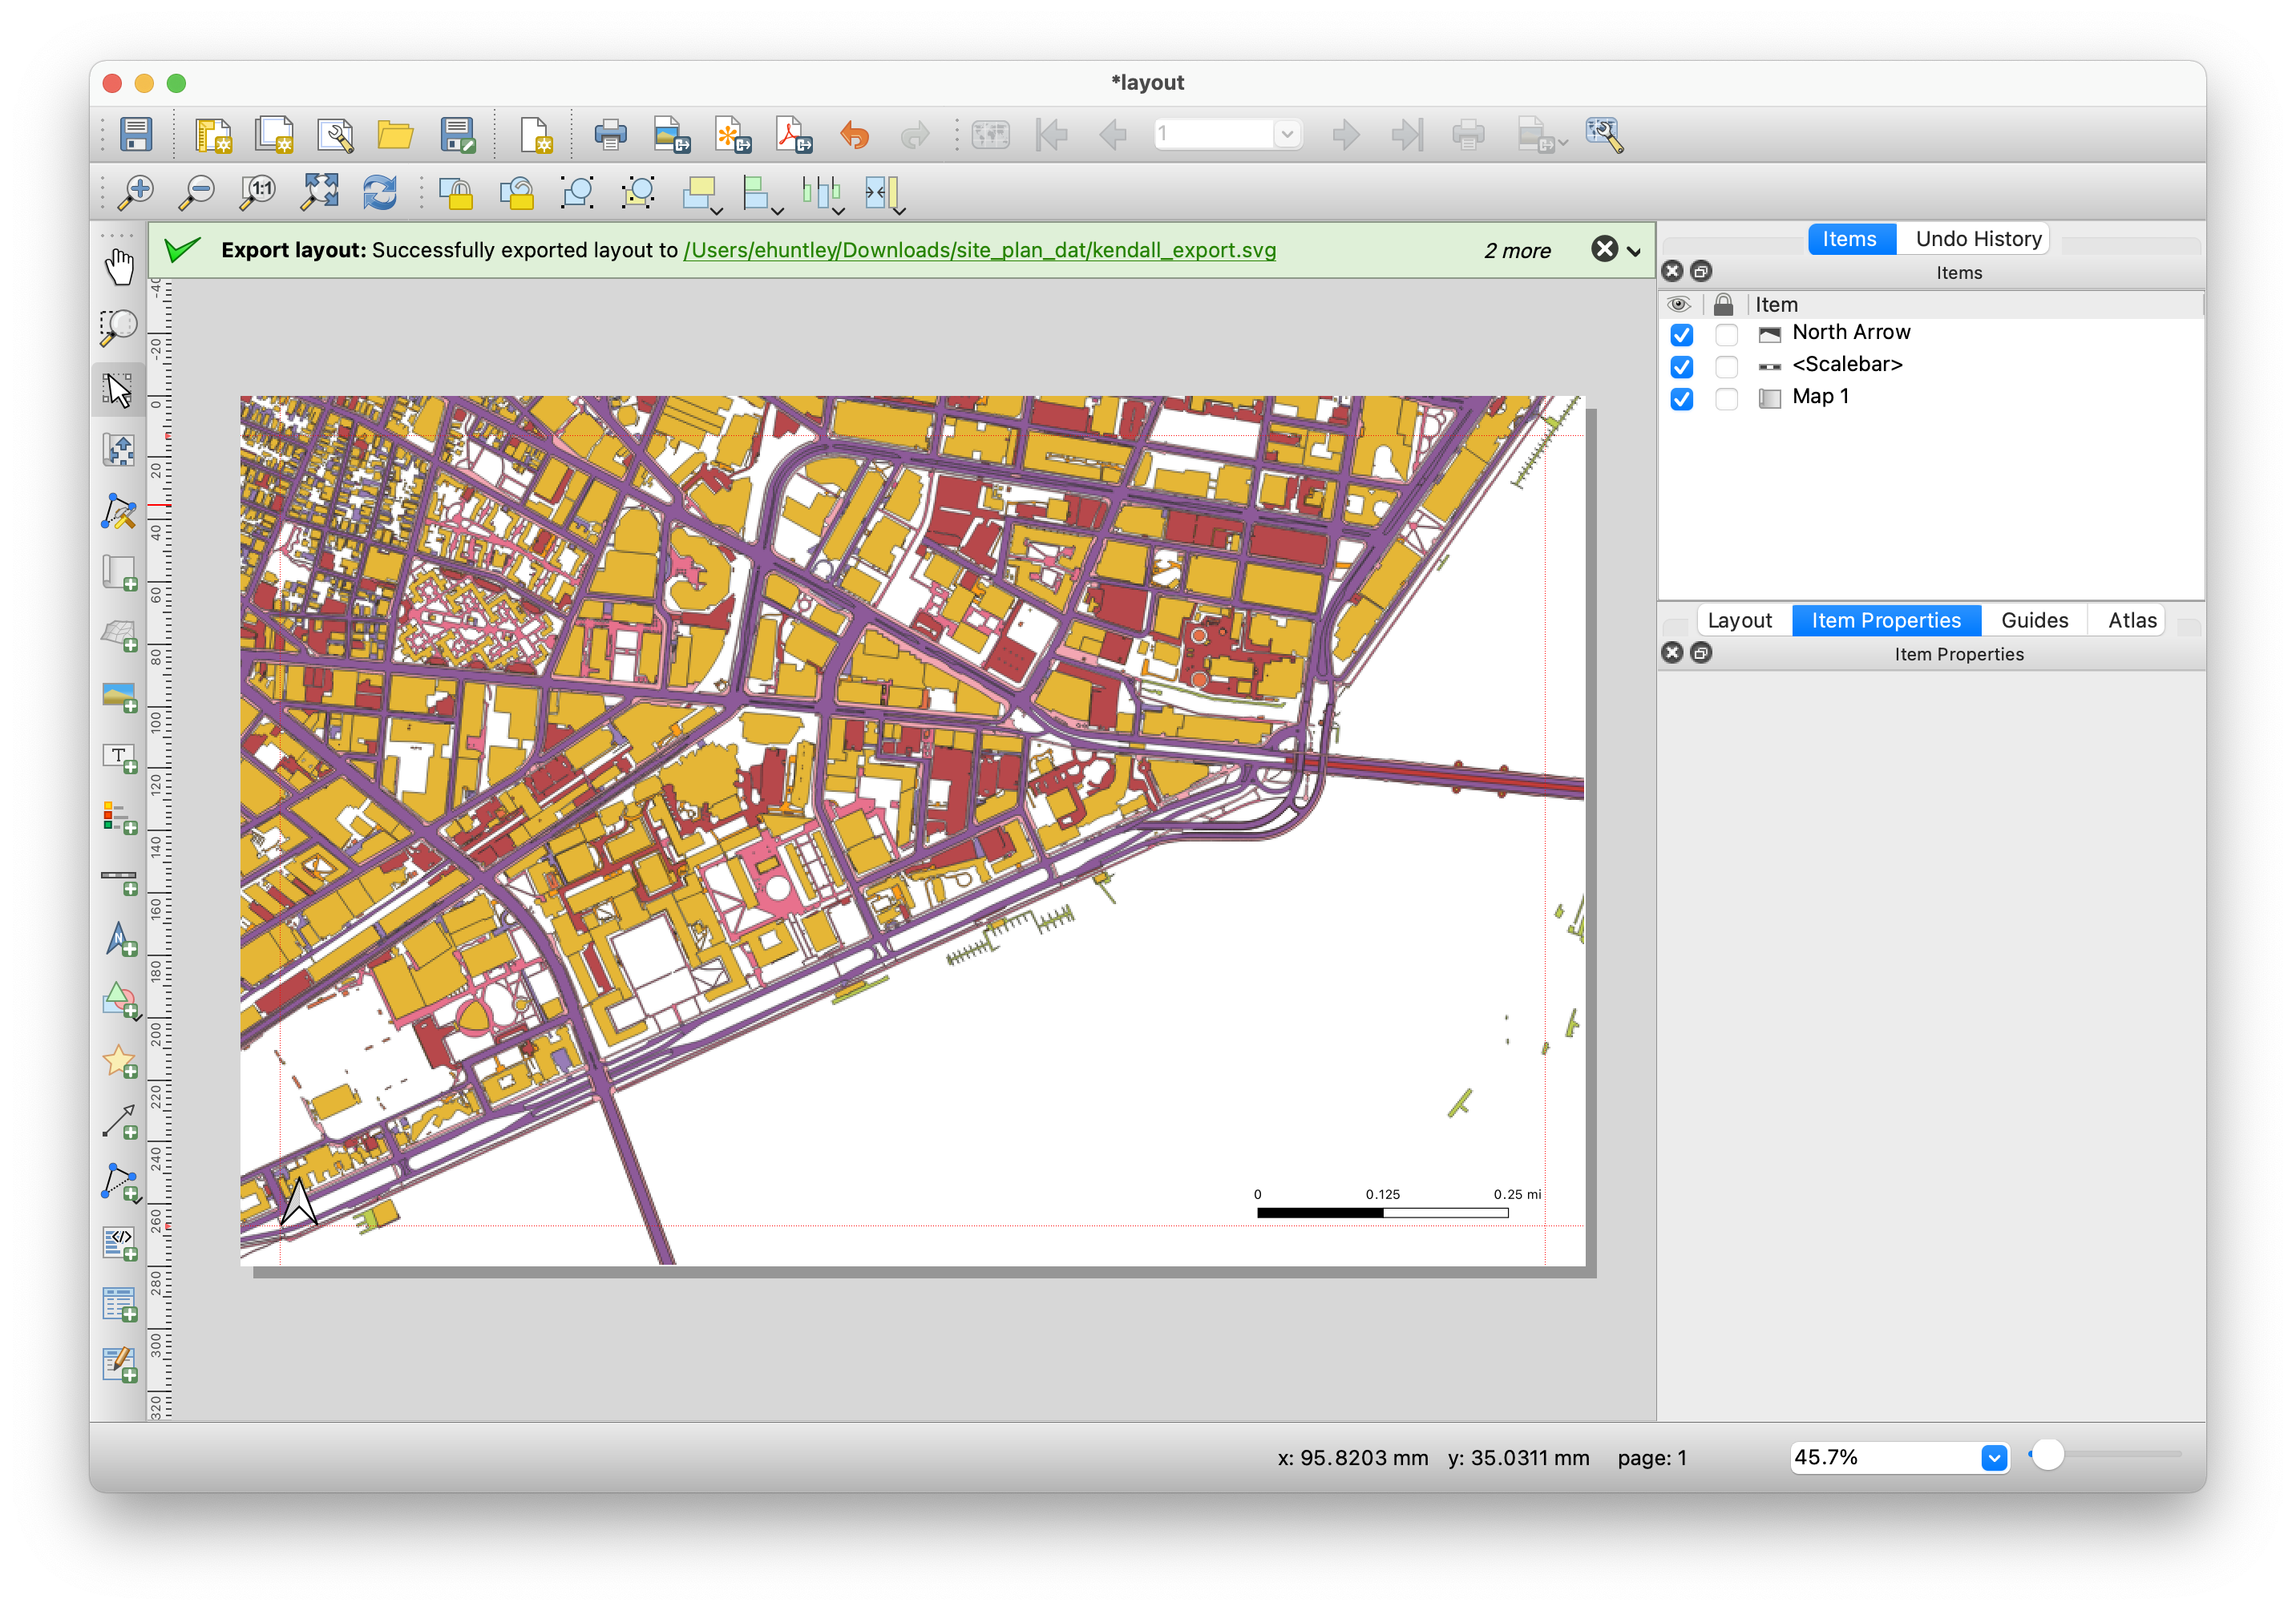
Export Your Layout as an SVG
We’re going to export the map as an SVG, or scalable vector graphic, format. This format is often the best way to bring vector graphics out of QGIS; it preserves layers and styles (to some extent) and Adobe Illustrator support the format fairly well.